Japanese Yen Q2 Technical Forecast: USD/JPY, EUR/JPY, GBP ...
This article focuses primarily on the technical outlook for the yen. For a deeper understanding of the fundamental factors driving the Japanese currency's trajectory in the second quarter, feel free to download our comprehensive Q2 forecast. It's complimentary!
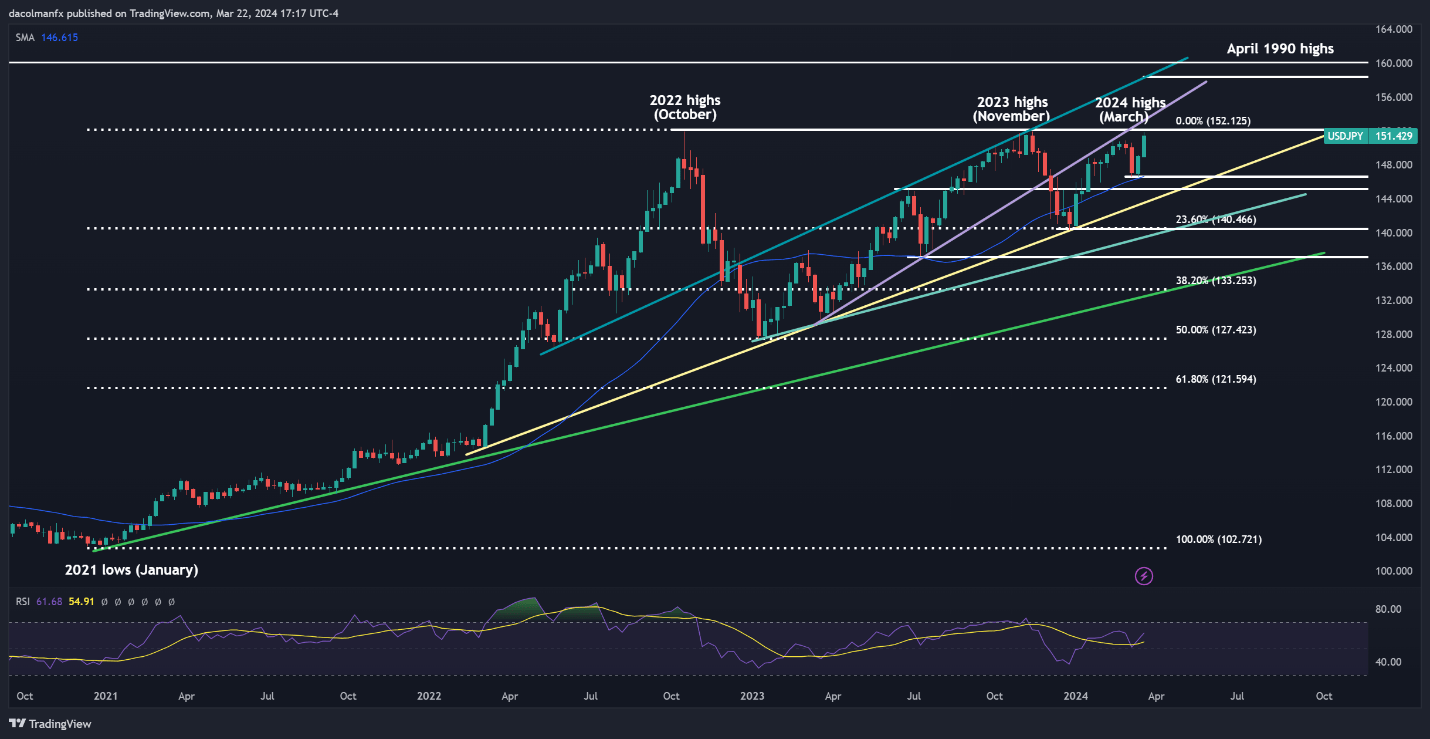
USD/JPY soared during the first three months of 2024, advancing more than 7% before the end of the first quarter. Following this upswing, the pair was trading slightly below its 2022 and 2023 highs, located near the psychological 152.00 level on March 22, an important resistance threshold that traders should keep on their radar in the near term.
In terms of potential scenarios, a push beyond 152.00 could theoretically reinforce upward momentum and give way to a rally towards 154.00. However, any bullish breakout may not hold for long, as the Japanese government may quickly step in to support the yen. For this reason, a rise above the 152.00 area could be viewed as an opportunity to fade strength. However, in the absence of FX intervention, bulls could feel emboldened to launch an attack on 158.50, followed by 160.00, the April 1990 high.
On the other hand, if USD/JPY is rejected from its current position and pivots to the downside, support emerges at 146.50 near the March swing low and the 200-day simple moving average. Below this, subsequent levels of support materialize at 145.00, 143.50, and 140.45, the latter marking the 23.6% Fibonacci retracement derived from the upward phase spanning 2021 to 2022. Additional losses beyond this juncture would shift focus towards 137.00 and subsequently to 133.25.
Source: TradingView, Prepared by Diego Colman
Interested in learning how retail positioning can offer clues about EUR/JPY's directional bias? Our sentiment guide contains valuable insights into market psychology as a trend indicator. Download it now!
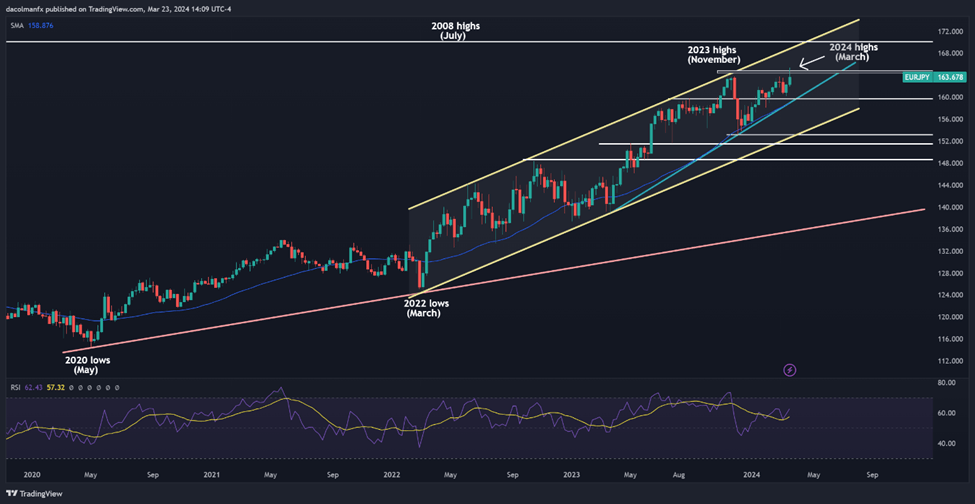
EUR/JPY TECHNICAL OUTLOOKEUR/JPY also advanced sharply in the first quarter of the year, briefly topping the 165.00 threshold, and hitting its strongest mark in nearly 16 years. While bulls appear to be in control of the steering wheel, we are unlikely to see a sustained move above 165.00 because Japanese authorities, who seek to prevent substantial depreciation of the yen, may step in to contain the bleeding.
In the unexpected case that EUR/JPY manages to break past 165.00 decisively and Tokyo remains on the sidelines, buyers may feel emboldened to launch an attack on the upper boundary of a long-term ascending channel at 168.75. If euro’s momentum continues to build unchecked, the market could set its sights on the 2008 highs near the psychological 170.00 level.
Alternatively, if upward impetus starts fading and prices shift downwards over the coming weeks, sellers may muster the courage to challenge trendline support and the 200-day simple moving average near 159.70. The pair may attempt to bottom out in this area before rebounding, but should a breakdown materialize, bulls may head for the hills, paving the way for a retracement towards channel support at 153.10. Subsequent losses from this point could precipitate a drop towards 151.60, followed by 148.70.
Source: TradingView, Prepared by Diego Colman
Discover out top 3 trading opportunities for the second quarter. Request the guide now!
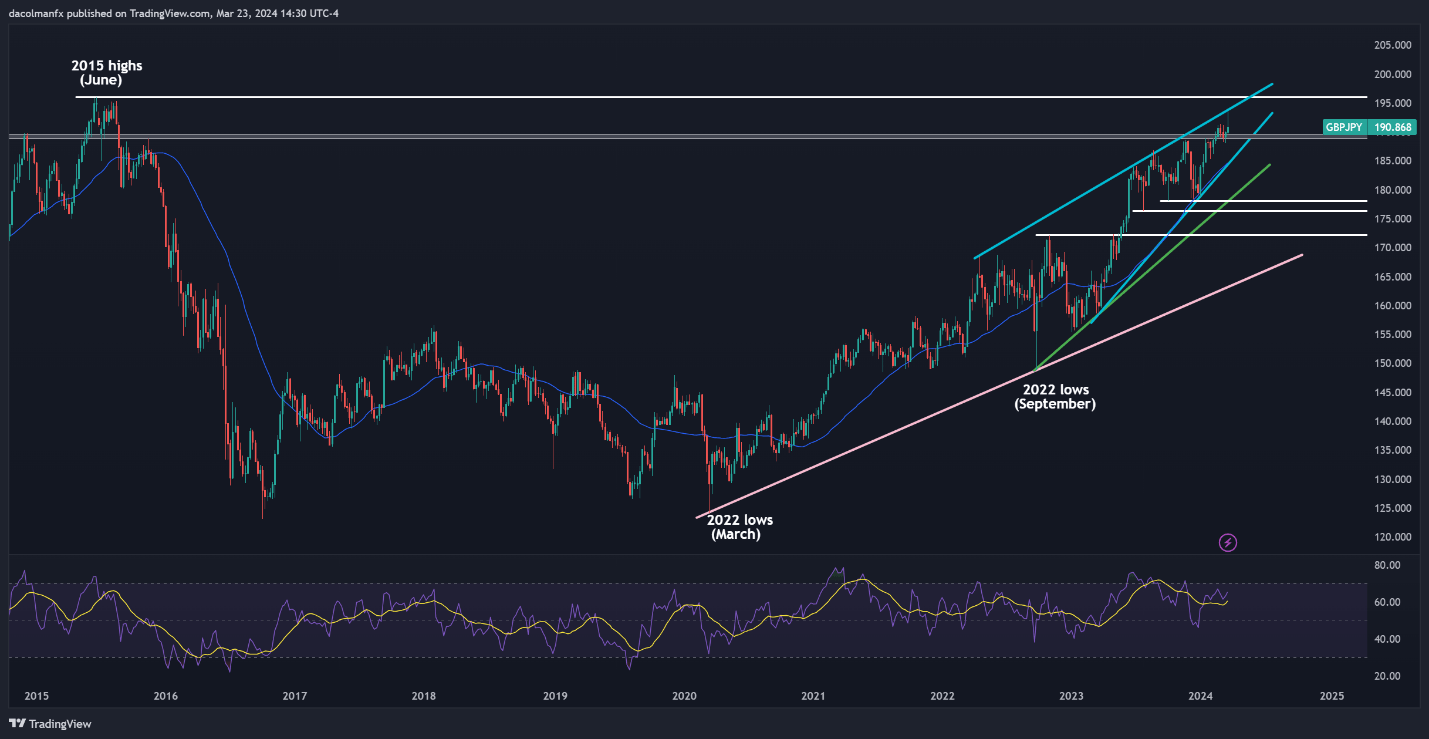
GBP/JPY TECHNICAL OUTLOOKThe British pound was no exception and also strengthened dramatically against the Japanese yen in the first quarter, with GBP/JPY rising above the 190.00 handle to levels not tested since August 2015. With traders positioning for a rate cut from the Bank of England in the second quarter and the Bank of Japan finally normalizing its stance, the path of least resistance may be lower for the pair in the medium term despite its constructive technical outlook.
In the event of a bearish reversal, GBP/JPY may encounter support around 189.00 and 184.75 thereafter, where the 200-day simple moving average meets a medium-term ascending trendline at the time of writing. Subsequent losses beyond the aforementioned thresholds could draw attention towards 178.00 - key swing lows of December and October last year. The pair may establish a foothold in the region; however, a drop below it could prompt a move towards 176.50, followed by 172.25.
On the other hand, if bulls maintain their grip on the market and propel the exchange higher, resistance emerges at 193.50, this year’s peak. Drawing from past patterns, bears may resist another bullish advance at this juncture. However, in the event of a clean and decisive breakout, a rally towards the 2015 highs near 196.00 could be on the horizon.
GBP/JPY Weekly ChartSource: TradingView, Prepared by Diego Colman
DailyFX provides forex news and technical analysis on the trends that influence the global currency markets.


