USD/JPY Price Forecast: Rallies past 144.00 boosted by high US ...
The USD/JPY edges up during the North American session, registering gains of over 0.90% as the US Dollar stages a comeback. The rise in the US 10-year T-note yield sponsored a leg-up in the pair, which trades at 144.54 at the time of writing.
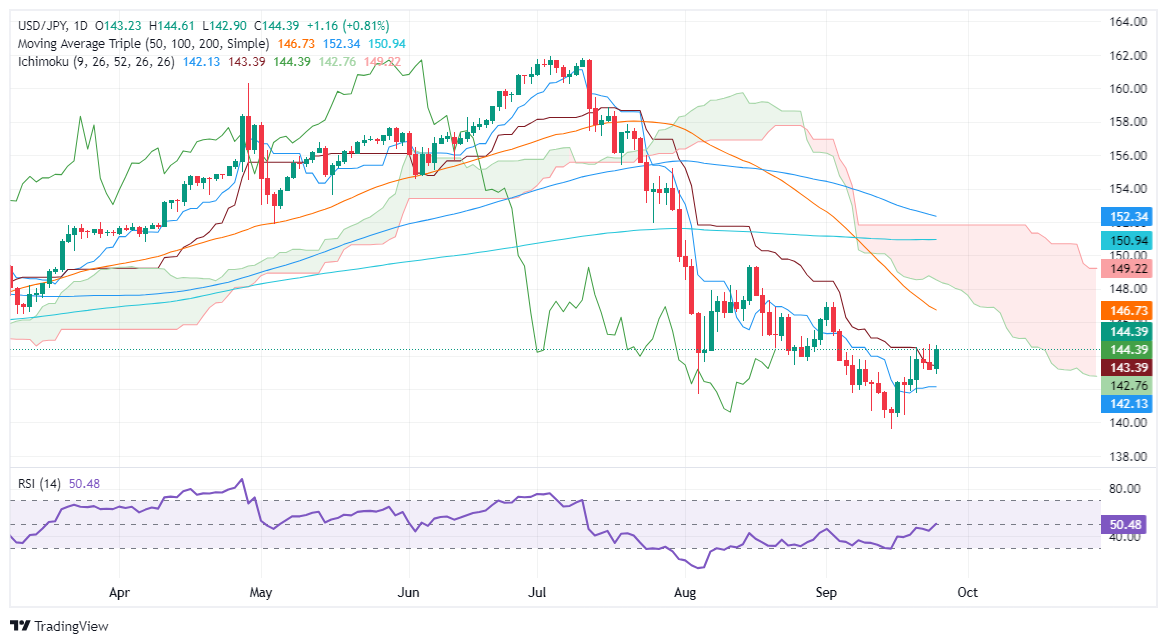
Despite rallying during the session, the USD/JPY remains downward biased, as the exchange rate persists below the Ichimoku Cloud (Kumo) and the 200-day moving average (DMA).
The Relative Strength Index (RSI) has just pierced its neutral line, opening the door for further upside in the near term.
With that said, the USD/JPY next resistance would be the 145.00 psychological figure ahead of testing the 50-DMA at 146.73. On further strength, the pair could hit the 147.00 figure.
Conversely, if USD/JPY tumbles below 144.00, this could pave the way to challenge the Kijun-Sen at 143.39, followed by the Senkou Span A at 142.76 and the Tenkan Sen at 142.13.
USD/JPY Price Action – Daily ChartThe table below shows the percentage change of Japanese Yen (JPY) against listed major currencies today. Japanese Yen was the strongest against the New Zealand Dollar.
USD EUR GBP JPY CAD AUD NZD CHF USD 0.22% 0.51% 0.82% 0.26% 0.75% 0.91% 0.68% EUR -0.22% 0.29% 0.60% 0.04% 0.53% 0.70% 0.45% GBP -0.51% -0.29% 0.27% -0.25% 0.24% 0.37% 0.18% JPY -0.82% -0.60% -0.27% -0.56% -0.07% 0.09% -0.14% CAD -0.26% -0.04% 0.25% 0.56% 0.49% 0.66% 0.43% AUD -0.75% -0.53% -0.24% 0.07% -0.49% 0.17% -0.07% NZD -0.91% -0.70% -0.37% -0.09% -0.66% -0.17% -0.24% CHF -0.68% -0.45% -0.18% 0.14% -0.43% 0.07% 0.24%The heat map shows percentage changes of major currencies against each other. The base currency is picked from the left column, while the quote currency is picked from the top row. For example, if you pick the Japanese Yen from the left column and move along the horizontal line to the US Dollar, the percentage change displayed in the box will represent JPY (base)/USD (quote).
Information on these pages contains forward-looking statements that involve risks and uncertainties. Markets and instruments profiled on this page are for informational purposes only and should not in any way come across as a recommendation to buy or sell in these assets. You should do your own thorough research before making any investment decisions. FXStreet does not in any way guarantee that this information is free from mistakes, errors, or material misstatements. It also does not guarantee that this information is of a timely nature. Investing in Open Markets involves a great deal of risk, including the loss of all or a portion of your investment, as well as emotional distress. All risks, losses and costs associated with investing, including total loss of principal, are your responsibility. The views and opinions expressed in this article are those of the authors and do not necessarily reflect the official policy or position of FXStreet nor its advertisers. The author will not be held responsible for information that is found at the end of links posted on this page.
If not otherwise explicitly mentioned in the body of the article, at the time of writing, the author has no position in any stock mentioned in this article and no business relationship with any company mentioned. The author has not received compensation for writing this article, other than from FXStreet.
FXStreet and the author do not provide personalized recommendations. The author makes no representations as to the accuracy, completeness, or suitability of this information. FXStreet and the author will not be liable for any errors, omissions or any losses, injuries or damages arising from this information and its display or use. Errors and omissions excepted.
The author and FXStreet are not registered investment advisors and nothing in this article is intended to be investment advice.


![Soon Huat-Shevon charge into China Open final [WATCH]](/_largethumb/uploads/news/113/11375/3/11375323-soon-huat-shevon-charge-into-china-open-final-watch.jpg.webp)
![Soon Huat-Shevon charge into China Open final [WATCH]](/_newsthumb/uploads/news/113/11375/3/11375323-soon-huat-shevon-charge-into-china-open-final-watch.jpg.webp)


